Showing posts with label calls. Show all posts

Saturday, October 31, 2015

thti


profile ymax fv plan is to buy at the late October dip low .642 and sell at the late October spike high, .9 THT Heat Transfer Technology, Inc. is a holding company. The Company's primary business is conducted through its subsidiaries, Siping City JuyuanHanyang Plate Heat Exchanger Co. Ltd. (SipingJuyuan) and Beijing JuyuanHanyang Heat Exchange Equipment Co., Ltd. (Beijing Juyuan). Qualifies as value, next level is $5.

mdsy


profile ymax fv called at 2

hrtx


profile ymax fv called at ~25

Wednesday, October 14, 2015

kool


profile ymax fv It's not a buy ... I'm watching it.

note

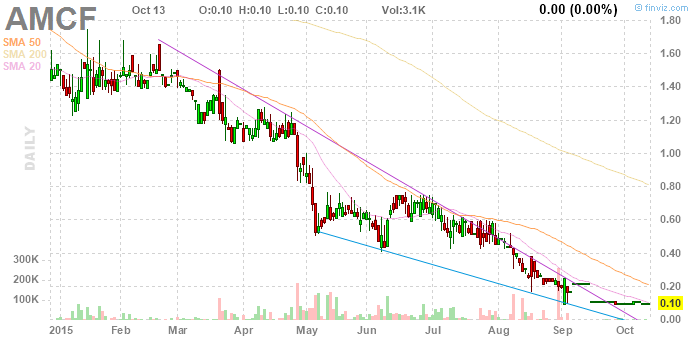
amcf


why the heck not? if we thing "sell at the first opportunity", we can go for a double
profile ymax fv

Tuesday, October 13, 2015

gtxi


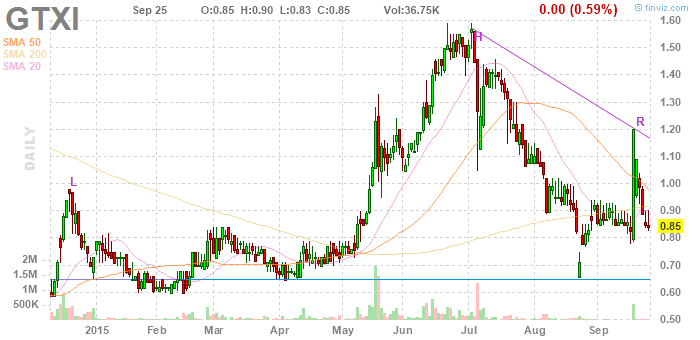
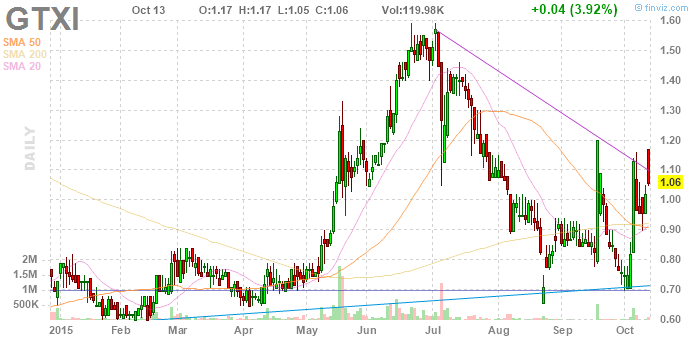
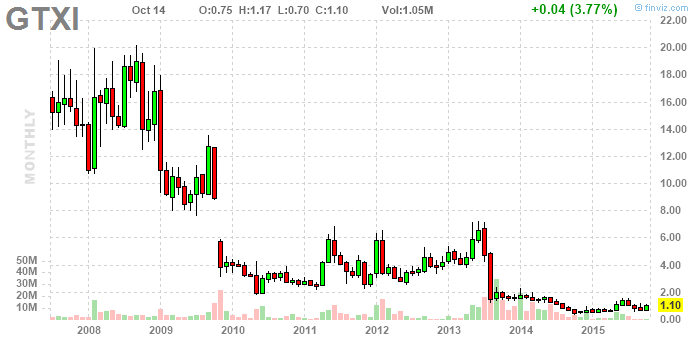
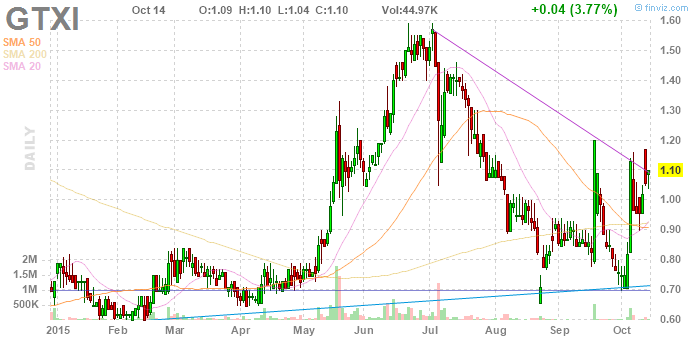
profile ymax fv (88)@.85forx1.5

trying to assess what to do here. that is a sell signal at 1.17 from the other day ... but ... I've decided it probably will still go to my target, 1.2 (or 1.3?)


note Oh, got it. It's setting up for a move to 1.4.

Saturday, October 10, 2015

cvrs


profile ymax fv note robotics firms have been ... I mean, I saw the name on the list of stocks under five dollars, and decided to take a look. and it has a chart - heels, in September, and then a breakout.

note

Saturday, October 3, 2015

baa


note nope, another reject. sure, maybe it's going straight to 10, but ... who cares? oh, well, buying a little and holding for 10.

note actually, i'm holding for way above 10. there's a smidge of fundamentals. it could be a real company, possibly. i don't know why we need more gold, but, ok, whatever. they sold a fair amount of it last year.

what i mean is this is a long term investment, but i'm not that confident so i'll only put in a little money. with a successful long term investment, a little turns into a lot, or that's a theory.

oh, that's right, i was looking at the other gold stocks and they seem pretty solid and ready to rally, but why? so i looked at the price of gold, and it's down over a five year period, and on the hundred year chart you can see how it'll now go up for a period of five years. that could be an answer, and it suggests a time horizon for this investment.
profile ymax fv note

note

note

vicl


profile ymax fv
note i looked at thirty charts, which is lackadaisical, but i picked this one.

some revenues, losses, a bundle of cash, r&d and sg&e expenses, stinky drugs ... too risky!

note

note

Thursday, October 1, 2015

amco


profile ymax fv (10)
wow. great chart. of course we all know those are famous last words for me. great chart, though. anyway, i modified my list reviewer so it now shows monthly charts. actually, in a way, the monthly charts have clearer patterns, like, much clearer patterns. this  is typical classic breakout behavior, writ larger. but then i found a number of nifty charts, but when i checked there were no fundamentals. one after another. (fortunately, with these posts, it's now really easy to check).

well, this chart made me think there might be more to it this time, and there was. (that doesn't mean i was right, just lucky.) it's, well, big enough, decent sized. it's in the scrap metal business, operating internationally. it did experience some losses, small by one measure, versus revenues, and then i checked their assets, and the losses, as it turned out (several years of them) were really just a trickle out of current assets. They seem to have a lot of current assets, and they've had a lot year after year. that explains the low price/book ratio, which makes it a Graham buy right there, and then there's this: they made money last year. it was a very small return on assets, but the p/e ratio is absurdly low. just that little bit of profit and, at this price, the stock is ridiculously cheap. Well, here's the deal: when they announce year end results last year, the price jumped from ten cents to two dollars. and this year, they're so far reporting a loss, but they are JUST ABOUT to report the quarterly results - they essentially are now doing so - aaaaaaaaaaand there's this buy signal. well, it's a fake buy signal, but i like it. when is the news coming out? why didn't it jump today? what's it gonna do tomorrow?!

Wednesday, September 30, 2015

chci split

The chci split coincides with a brilliant chart pattern that predicts a vary fast double. The chart here is ALL screwy, due to the split, but another chart, (profile, 6 month chart) shows the trade vividly. There's a perfect candlestick for buying setting the buy price at 3.6 (already filled if you saw it yesterday, which I didn't) and a perfect top for selling at 6.2 ... it's perfect.

I'm starting to really like reverse splits ... if you buy after them.


y mw fv note the big green bar is completely meaningless, but you do see the price. Our target is 6.2. I had to look at other charts to see the trade, but it was signaled by this ridiculous spasm that meant nothing. I thought to write to someone else that the trade was signaled by a completely arbitrary event, and doesn't that sound good?

Tuesday, September 29, 2015

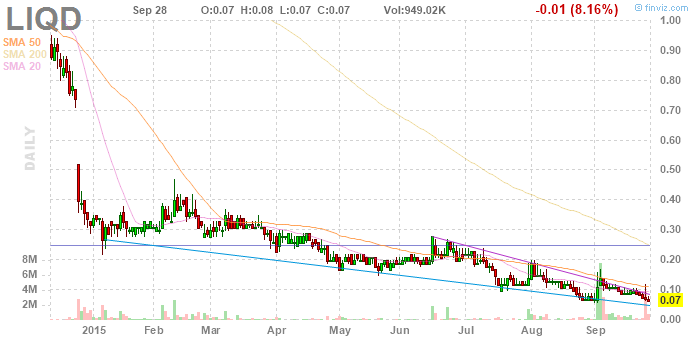
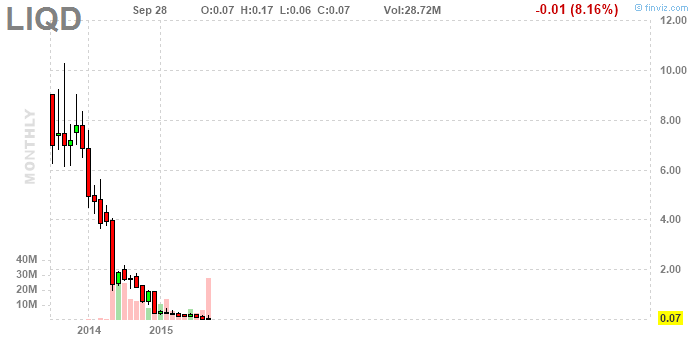
liqd


y mw fv note this has everything for an instant double - a  tripple, really.

note

note

note

Sunday, September 27, 2015

inph


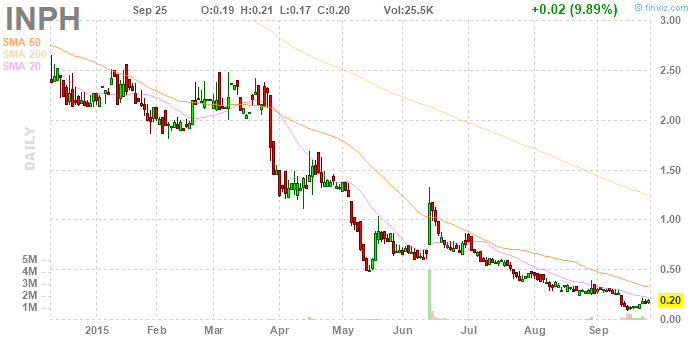
profile ymax fv september30 there was ... oh ... a bottom, a buy signal, at something like .15, a few days before this. that's the buy price. it's kind of just the hint of a bottom ... who knows? ... but it is priced, and the marked price for selling is there at 1.5, no, 1.3, if you're very on the ball, aor at .75 if you want to make it automatic ... (99)@.20,.10,.05for.80 expect now a top at .4, and then i think it will dip. let's say it dips to .1 and then makes a buying pattern ... then it's a buy ... but it could dip to .05 and you could get that with an open order. but if it gets below .1, or, really, .15, and it makes a buying pattern, that buying pattern becomes the buying pattern ... i'll update with exactly what i'm seeing if things develop this way ... or otherwise ... pre-pattern sell signals are tops at higher prices in the chart action before a trade, that is, in the pattern at the time of the trade. when i predict 100x appreciation based on the historical pattern, it's likely i'm ignoring all sorts of prepattern sell signals, but studying short term patterns i'm noticing that those prepattern signals are actively meaningful. the likelihood of a quick sell should go up a lot. so here are sell signals at .4 - like i said, after that comes a low price buying opportunity, and then .5 and .6, with not very prominent tops, and, besides, there's a prominent top at .8, and that's the target. we'll adjust our sell order as that price is approached, and we should be able to sell very close to it. there will almost certainly be a retracement after it gets to that level (although the actual top is likely to be closer to 1.3, or even at it, which we'll keep in mind as the trade develops - assuming it does develop.

i looked at about twenty stocks, and about 15 of them were giving buy signals. is this some kind of market bottom? anyway, i selected the top five based on projected gain as per the prepattern sell signal theory, and logged them. the bottom ten of those 15 with buy signals had only projected gains in the under 50% or under 100% area, but then i started to find some with 2x and 3x projected gains, using the same rules, and being conservative with them ... though, granted, it's hard to apply them very strictly. anyway, Kiyosaki was talking about looking at 100 properties before choosing one. the first one looks great, but then so do the first 20, and then number 21 is like several times better, i think i the effect we're looking for. and we're not anywhere near 100!

this morning i ran a test on historical data. i looked at several charts, just like normal, but i looked for buying patterns in August and, as it turned out, July. first i was turning up duds, but i studied them more closely, and the prepattern sell signals had not predicted much. one with better prepattern prospects did fine - and the others did fine according to the rules, there just wasn't much upside in them to start with. with this in mind i started looking at current patterns again and came up with this trade.
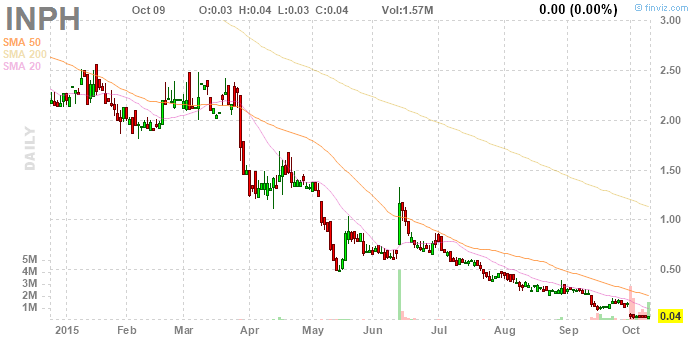

buying another $100 lot (on paper)

Saturday, September 26, 2015

calls


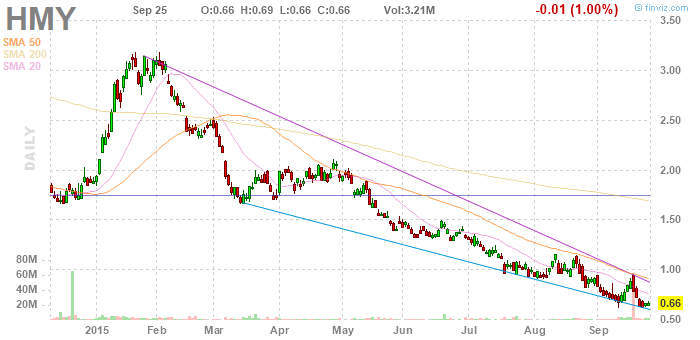
profile ymax fv (92)@.66forx1.5


profile ymax fv (90)just watching


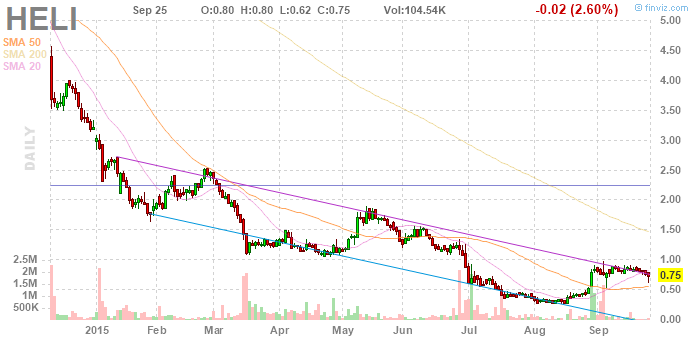
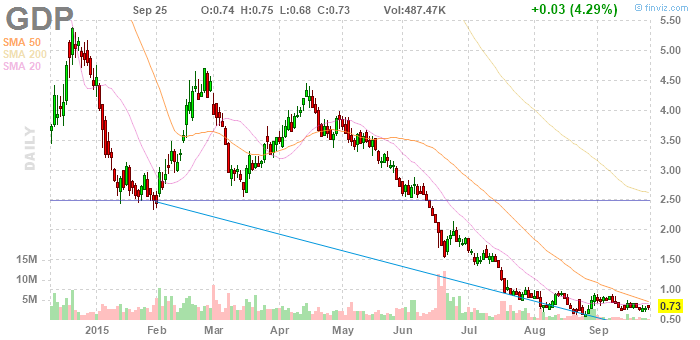
profile ymax fv (79)@.73forx2


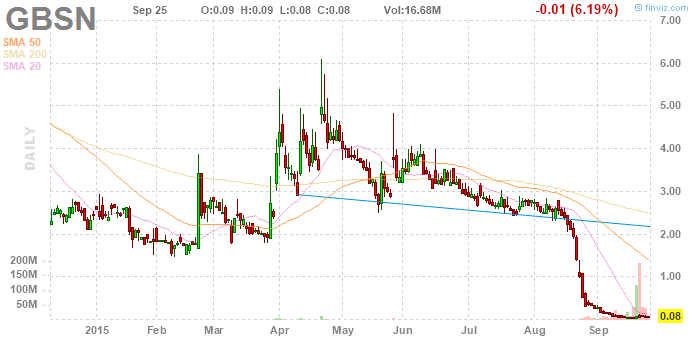
profile ymax fv (78)@.08forx3


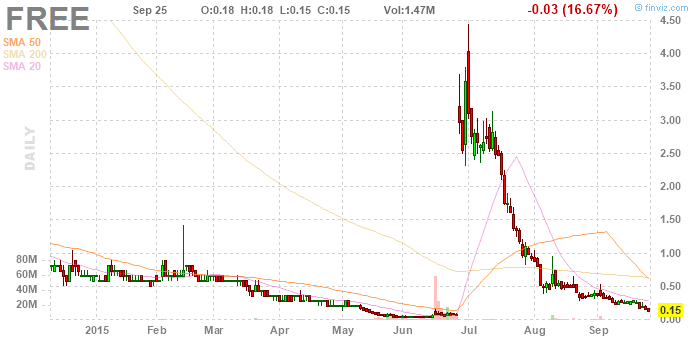
profile ymax fv (76)@.15forx3


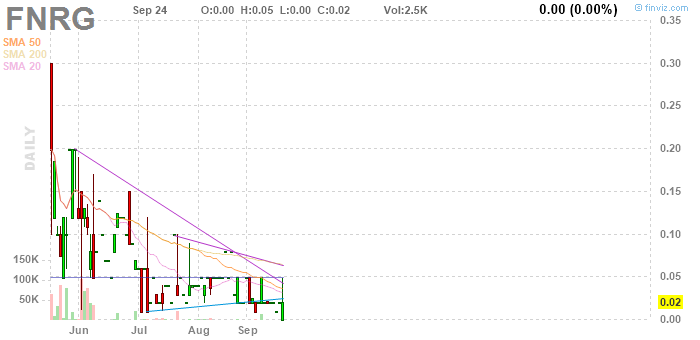
profile ymax fv (75)@.01forx5 esoteric