profile ymax fv
Showing posts with label doubles. Show all posts
Showing posts with label doubles. Show all posts
Tuesday, November 3, 2015
Friday, September 25, 2015
cpah
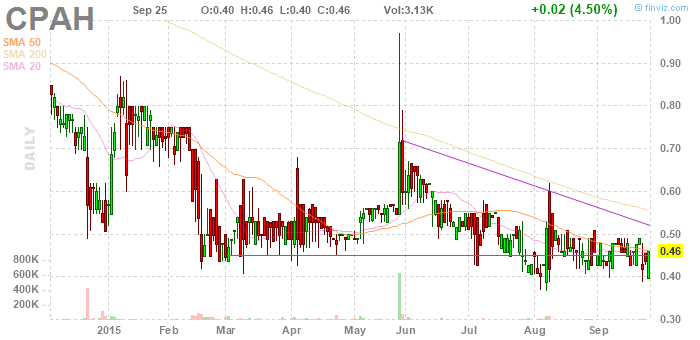
profile ymax fv September25buying (on signals) in 2014, at .55, with a sell signal at .78, for something like a 40% gain, then in Feb at .44 with a sell signal at .62 for a 30% gain, then in April at .5 with a sell signal at .68 for a 30% gain, then at .6 in June for, by now, a break-even if you sold it in August, and in July at .44, remember that price? with a sell signal at .58, the July top, for a 30% gain, and now signals in the .44 area, again, and we might get one in the .40 area, with a sell signal at .62 for a 50% gain ... so, this stock is not that great for short term trading! but it does produce +30% trades regularly.
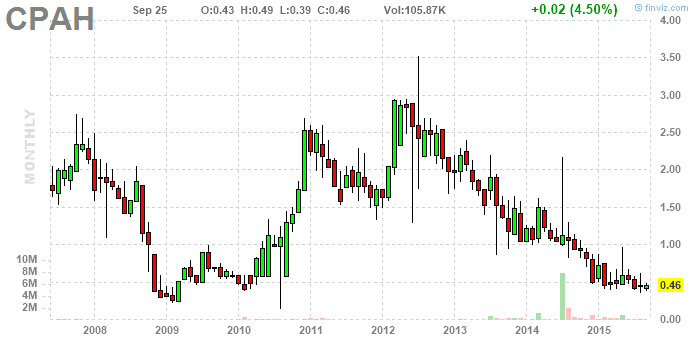
it is, however, well positioned to go to $3.50 and to still be there a year from now.
i'm back with more to say. my whole premise, posting all these charts today, is to get perspective, and am i ever! for example these monthly charts are really starting to speak to me. buy signals at 18 in 2008, at .4 in 2009 with a full sell signal at a predictable level at .75 for a near double, at .6, .7, .6 and then in 2010 at .5, a nice one, and all of those quickly doubled, and then what do you know, it spiked right down to the lows again. gotta remember that. then on to the next level, which was 2, marked in 2008, then buy signals at 2.2, quickly becoming a sell signal at 2.1, then buy signals at 1.8 and 1.7, with sell signals in place at 2.25 or 2.7, take your pick, a buy signal at 2.8 becoming, not surprisingly, a sell signal at 2.8, when the price spikes lower, which we would have seen it doing on daily charts, thus, a buy signal at 1.4, really, with the sell signal in place (the dragonfly) at 2.8, then another dragonfly, and another spike lower, and no recovery, but there's the third dragonfly ... interpret that ... it's a buy signal, and then it spikes to ... oh, forget it ... the third dragonfly becomes a stop, and the buy at 2.50 becomes a 20% loss. a buy signal at 1.50 in Fall 2013, a buy signal at 1.25 next, with a sell signal at 1.60, a buy signal at 1.10 with the same sell signal still active, and it makes a top there, too, buy signals, buy signals, buy signals, lower prices, and now, buy signals, at .5, with a sell signal in place at a dollar.
is this a longer term buy now. in the abstract, absolutely ... long term buy. but i'm expecting a top at $1, so why not wait? and then, after that, i'm expecting a top at $2, so why not wait for that, too?
hmmm. trading in and out every three or four months is what this amounts to. frankly, i'd prefer not to have to wait that long. maybe i'd like to trade in and out every three or four weeks! does that mean i should focus on weekly charts?!!? regardless, what i've just described is a version of inching forward, with gains of (some modest number of) percent per trade. but, if it's reliable, inching forward couldn't exactly be called a bad thing. am i scrambling? maybe i'm scrambling. but if i'm making progress and i like it, maybe i should scramble. those daily bar charts make buying patterns ...

cntf
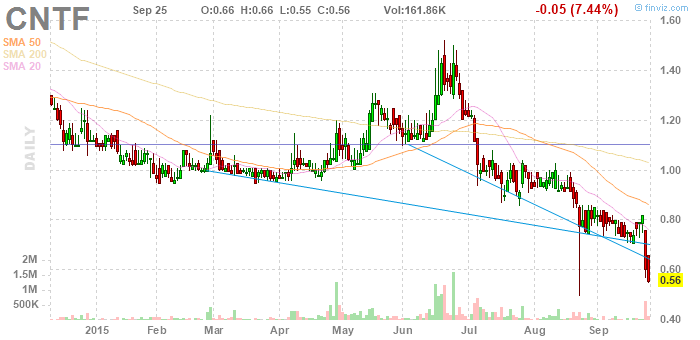
profile ymax fv September25buy signals all through the Spring with not much to show for them and now it's buy signals, into the fall, i suspect, and i like them ... buying around .5 for a quick double ...
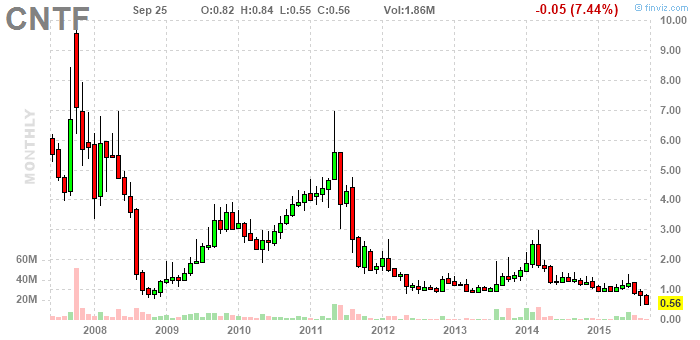
buy signals early, at 1, topping out at 4, easy, buy signal at 4, then at 2, then at 1 again, and again, topping out, not irrationally, at 2.75, then at 1 again, and now at ., well, 9, .9, but we might see more at .5 ... that's it, it's a buy, short and intermediate term ... about the long term, maybe not ... but, maybe.
cnet
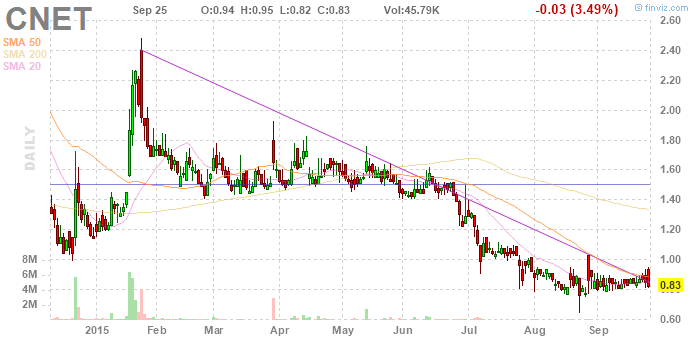
profile ymax fv September25 buy signals in December and January each produce a nifty double or almost (see comments on exiting, elsewhere on the blog). then there was a wave of buy signals that produced, thus far, the opposite of a double, and now, lots of buy signals that i think will produce another nifty double.
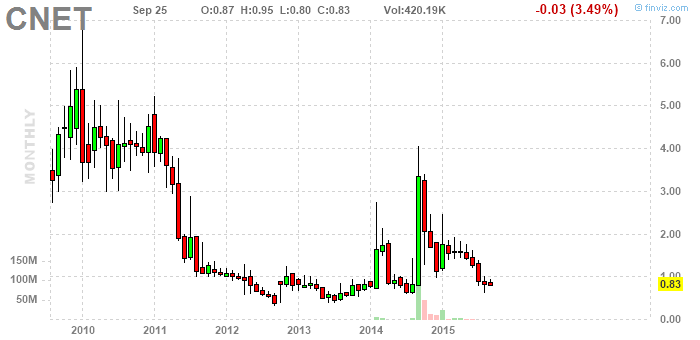
buy signals in 2012 - throughout - and 2013, for a nifty double (price marked at just below 3 in 2011, so, a tripple, really ... but see here, this is now an intermediate term signal we're trading the way we usually trade a short term signal, almost ... it seems we need limber minds to really play this game ... but that's why we're studying all these examples ... and then in 2014 for another nifty gain ... it's intermediate term trading, based on monthly patterns, but we're out in a month ... and buy signals right here and now, again. the short term target is a double, the intermediate term target is $4, and, is this a buy and hold play? of course it is. i mean, there's a volatility question, but my bet is it's a good company. we are building, by the way (in this hypothetical environment) a portfolio of Chinese stocks. what, you're not impressed?
actually, i'm going to say no to buy and hold on this one. the strange thing that's happening is a built in bias in our strategy towards the short term trade, not because we think it's superior but because we see so many short term signals, and our strategy is essentially to put $100 into every signal. or, in this chart, there are all these intermediate term signals ... and then i think here they kind of rule the roost, for now. if we buy and hold we'll have to hold through plenty of low price episodes, i think.
clrx
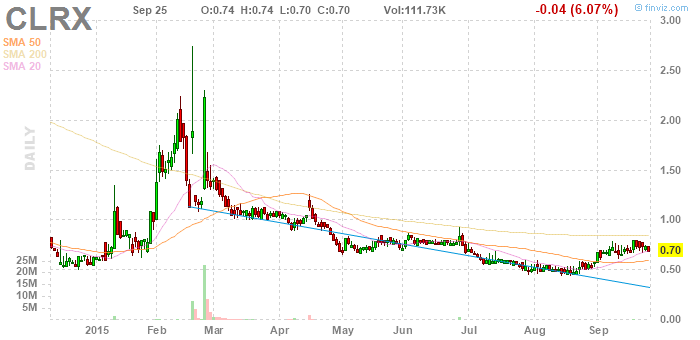
profile ymax fv September25it goes on and on and on. wait, do i own this? anyway ... buy signals in December, and in January, and both produced a nifty double. then there was the dragonfly in mid Feb, and a dew drop the next day, both buy signals, if at elevated prices. Also, the dragonfly became a sell signal as soon as the dew drop formed. if you thought about it that way you could have traded it. then, signals all through every month since, even right now, this instant, fine for an instant double.
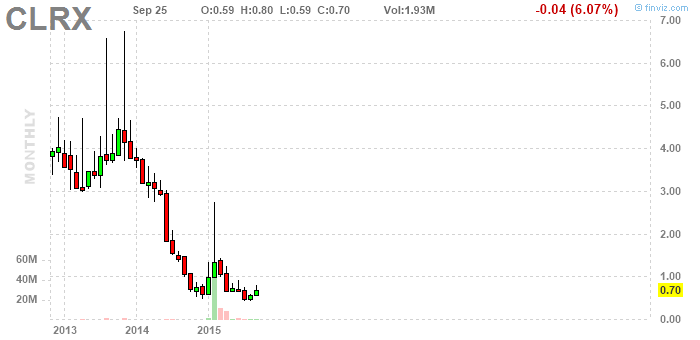
i guess this wouldn't be my first pick for buy and hold, or intermediate term trade, either, not that there's anything at all wrong with it. what do you think about the company? (see the profile link)


chci

profile ymax fv September25buy signals at a dollar in January and going forward, at .70 cents in May, at 55 cents and all the way down to 51 cents in May, with, arguably sell signal at .72, then buy signals in June at .55, in July at .5, and in August at .45. no double, but there was the June top marking +75%, and then the August top marked basically the same price, if you didn't grab the August sell.

promising more tops at $3.50 in coming years, but, not quite a bottom, here. signals, though, all around 50 cents ... but also, some below there, so you might want to expect some lower prices. there's no short term signal, at the moment (for a change). (watch for some any day.)


cccl

profile ymax fv September25buy signals? check. 80 cents. and it did double out of the late 2014 bottom, where there were buy signals everywhere.

great for buy and hold, as well as for spikes to 4, by the way. anyway, who wouldn't want to own China Ceramics?! (Buy and Hold is the key to turning small investments into a fortune long term.)
cali

profile ymax fv September25buy signals at $1.20 in March, April, including off a breakout in April, but, no double. where was the target? you figure it out, the clue being the January top? buy signals now, 80 cents, going for a double seems reasonable.
what is freaky is, every single stock on my list looks attractive. these are finviz stocks, a more or less conservative selection of six thousand or so stocks, and we're looking only at those under a dollar. (they were under a dollar when i built the list, anyway, and most still are, it seems.) what am i suggesting, that we just buy any finviz stock under a dollar? i would say i'm saying you probably could get that to work, but is it actually automatic? if you stick to a buy and hold strategy, it's a possibility. (for comments on a less automatic approach see the posts.)

see, there's a pragmatic interpretation, which is that a spike to $5 is likely, taking a longer term approach - with more contact with the $5 line over a period of a year plus. of course, outright buy and hold promises a price of $36. now we've got three kinds of trades, short term shoot for a double type trades (here it was shoot for + 50%, back in the Spring), long term but shooting for a target, so, maybe the trade only lasts for months, and then buy and hold. we are, this is the plan, taking multiple small positions, so, somehow dividing all those positions up between the three categories ...
bxc

profile ymax fv September2buy signal right here, right now, though i'd peg it as early type. why do i feel that way? how can we distinguish one from the other. we did see some post breakout signals, earlier, that's true. well, taking a stab at a double might work out.

now what is it i'm saying? have to think. ok, it should hit six a couple of times in the next couple of years. maybe it expires worthless, is the other possibility. sideways for months and months is possible. what do you think of the company. (see profile)
bspm

profile ymax fv September25a signal at $1 in February, if we interpret the patterns very freely ... did not double. let's seeeeeeeeeeee. even the top in February could have been viewed as a signal to sell at that price, which was seen again mid March ... but is that how we handle trades? signals in May, ... July ... August ... September at .62 or something, very good ... target is 1.3, really. only the best price will double, I guess.

i like it for a buy and hold approach, and these are buy signals. (buy and hold is a years' long thing, promising nothing in the short term, at all.) we are looking for two things: quick doubles, and longer term 10x or greater gains. long term target is $10, for an early exit, $16 just holding it.
bsi

profile ymax fv September 29 I'm re-analyzing. According to the theory, this will make a succession of tops, at 2, 3, and 4, which last will put in place a top of several years' duration. After each top the price will dip and then there will be more buy signals. Question: when will it break out above a dollar? I'm sort of thinking it will make a wider bottom in the .65 area now. Today's .84 high could be part of a developing wedge. That would sort of qualify.
September25compelling right now, with buy signals. a double looks pretty doable.

scary, but with upside potential, too. really, a rally to $2 next month? yup, it's a possibility.
biod

profile ymax fv September25buy signals everywhere, right from the very beginning of the chart, at lower and lower prices, and definitely ending with one ... but, it's not that compelling.

the first signal was at 10 in 2008. February 2011 was a signal, and there have been signals continually since. The target for a trade seems to be 20, now. how do we approach being selective, here? I have no idea ... but buying now sort of is by default.
bgmd
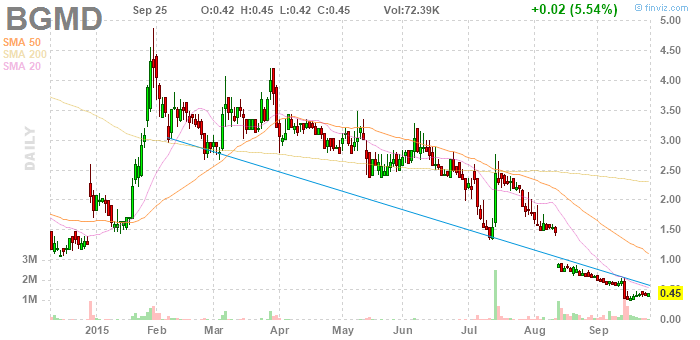
profile ymax fv September25clearly buy signalling at 1.25 in December, 1.60 in January, for clear double. Buy signalish in February at $3, $3.25, in May at 2.75, in June at 2.5, then 2.4, in July at 1.90, then 1.50, and in August at .90, and then .40. Seriously? We want to buy all of those signals? I'm trying to think what to think. The January signal at $1.60 was post breakout. (I see a signal in there at $2 early January, as well.) All the signals in the $3 are are post rally, but I'm not confident I could rule them out. The July signal at $1.50 is post cascade, which I would normally say is special, but not here. Only a small jump follows. Right now it's a double cliff. The first cliff (August) didn't produce a rally, but the second cliff could be a charm. Anyway, if there's a rally to even just $2.50 then all those earlier trades around that price become break even trades and the trade at forty cents becomes quite profitable.
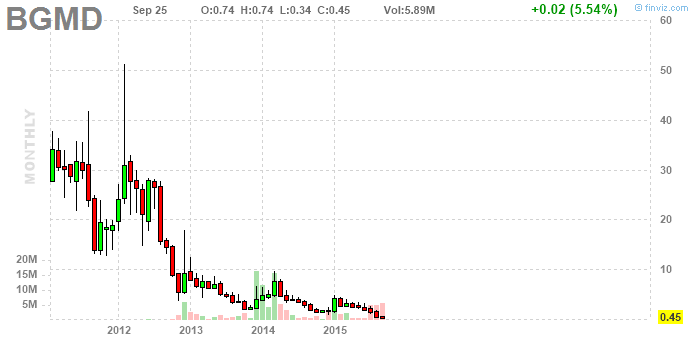
historically very low prices. that alone suggests the possibility of a long term type windfall, although a sharp top at 50 is predicted ... and the company could fail outright.
bgi

profile ymax fv September24distinct signals in November turned into an exact double. Note the early exit marked by the November top at 1.70 - selling in December at that price for a 75% gross profit. Buy signals in February, even in January, at 1.40, then 1.25, then at 1.20 and then 1.05 in June and July. Buy signals at .9ish in August and September, and at .80 later in September. And what's the meaning of a wedge like this. (The whole year long pattern.)

not so much upside in this chart. long term top predicted at $2.50
Subscribe to:
Posts (Atom)