I'm starting to really like reverse splits ... if you buy after them.
Wednesday, September 30, 2015
chci split
The chci split coincides with a brilliant chart pattern that predicts a vary fast double. The chart here is ALL screwy, due to the split, but another chart, (profile, 6 month chart) shows the trade vividly. There's a perfect candlestick for buying setting the buy price at 3.6 (already filled if you saw it yesterday, which I didn't) and a perfect top for selling at 6.2 ... it's perfect.
I'm starting to really like reverse splits ... if you buy after them.
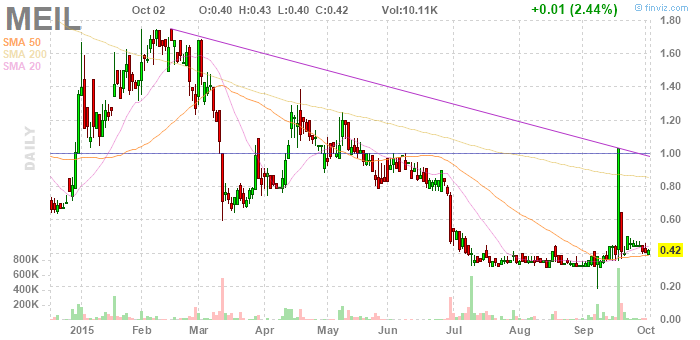
 y mw fv note the big green bar is completely meaningless, but you do see the price. Our target is 6.2. I had to look at other charts to see the trade, but it was signaled by this ridiculous spasm that meant nothing. I thought to write to someone else that the trade was signaled by a completely arbitrary event, and doesn't that sound good?
I'm starting to really like reverse splits ... if you buy after them.
Tuesday, September 29, 2015
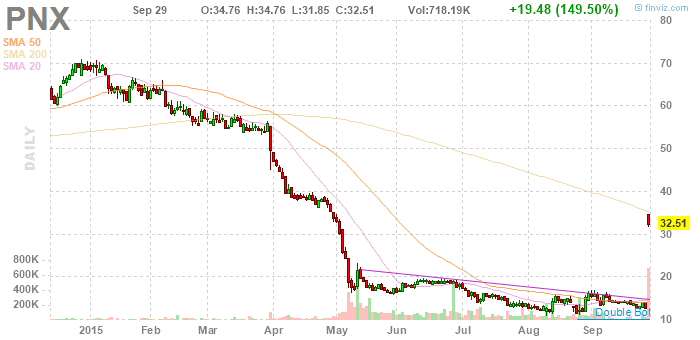
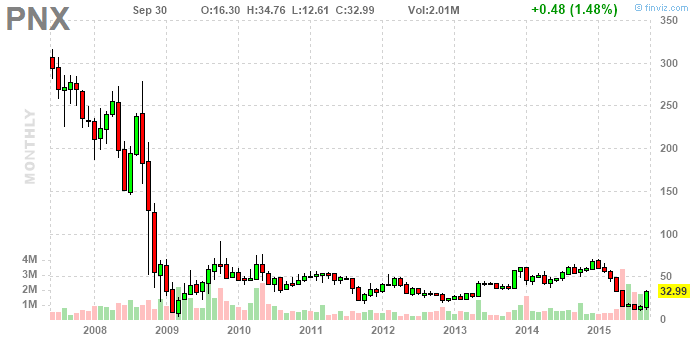
lptn(116)
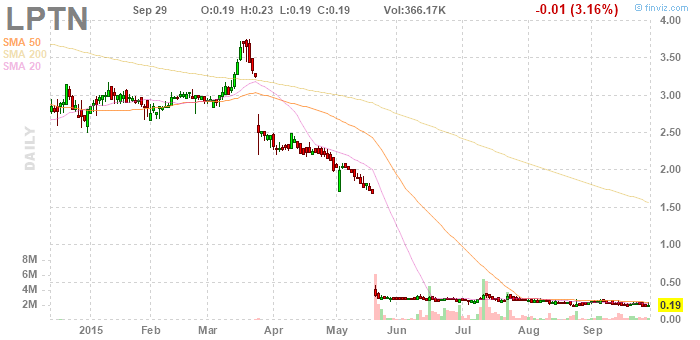
y mw fv note i simply cannot predict whether this will move immediately or only after more months have elapsed. there's nothing definitively telling me it's ready to move right now, even though it is making buy signals, and it is extended sideways quite significantly. i would say there is a very high probability it will go up, quite a lot, and fast, once it gets going. tops are predicted at a dollar, two dollars, three dollars, and four dollars. what do these offer? a slight reduction in risk?
suddenly i feel this is not the kind of chart to look at for short term appreciation. it's more of a long term chart. i'm gonna look for a different kind of pattern for short term trading.
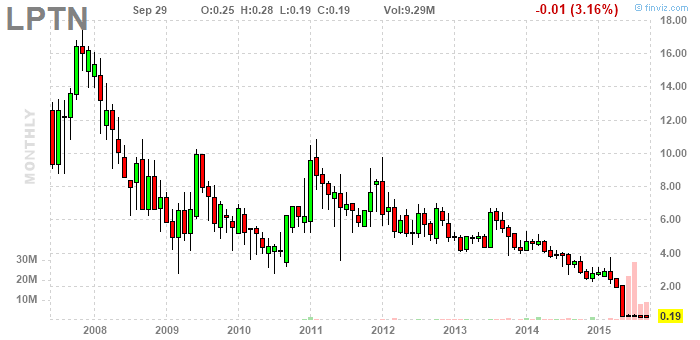
note upon consideration i say expect a series of tops at $4 over a period of years (with prices returning to under 50 cents between them). after that it can move up to making tops at $10.
what is my theory about these tops. i don't think it's a complete given that selling just because a top is forming (then buying back when there are sell signals again) will increase profitability, but maybe if we can sell very near tops reliably, it can. how likely is it we will be able to do that? well, in the case of some tops, we won't be able to do it ... unless we watch the market intraday. in other cases, though, when a rally is developing towards a predicted top at a more leisurely pace, say, over a period of days, even weeks, we might indeed be able to sell near the tops.
note
note
Monday, September 28, 2015
about the crash
Gustad, Monthana ..., Yumi ..., Dallas ..., Mary, Russel, the rest of you ..., Kiyomi ..., Mom, Dad ..., Anne ..., Doris ..., Elisabeth ..., and Liz ..., ... Elizabeth ... Elizabeth ..., Martha ..., Russel ..., Gerdhar, Ahmed ..., Mr. Carr ..., Alicia,
Curtis! Isabel!
In 2030 we were forced to sell our shares of AIG, after a long and profitable ride. I mean, we knew that, at the outset, that we would. Anyway, now the market, which had been taking such exceedingly good care of our money for a decade and a half, was going to take a break. It was going to take a break from keeping our money for us, and not only that, but making it grow and grow, and not only that, but paying us exceptionally large dividends, it was going to take a break from all of that. It wasn't even going to keep our money for us any more. From now on, it was only going to keep one tenth, or even just one one hundredth of our money for us. Shutting down. Sorry, the cash cow is entering her interval of not providing milk.
It was, then, sell your shares for cash, or say goodbye to your money. So we took the cash. We did. We did it, knowing. Knowing that now we had to take care of our own money. What do you do with a huge pile of cash? You need to invest it. But the market has shut down. The big bruisers from whom we've been raking it in are all reeling. They're down 90%, down 99%. It wasn't any good looking to them. The very face of reality was dissolving before our eyes ... and what remained, in the mist of its dissolution? A teeming hoard, even, of entrepreneurs, and a parade of them, too. And what were they all looking for? Cash, which is what we had been forced to take.
Now, though, we had to organize things ourselves, and the quicker the better. Handouts were an expedient modality, but the stock market had not, in fact, ceased to exist. If you looked in the right places, there were still expert organizers, even actually documenting their work in various kinds of filings. We knew this, and looked for opportunities.
For example, this architect in Guadalajara was developing in space, which seemed to be the trend of the future, what with the development of structural matrix and all that. He was doing shells at a fairly rapid clip, sort of as a hobby, and he was good at it. He was developing a space for making armatures, in the hills, there, too. He needed cash for some of that. Good communicator and alert thinker. We were in business.
Mind you, this kind of thing was still speculative. I mean, the structural matrix demonstrations were impressive, but it was definitely a new thing, and there were lots of questions about it. Well, we liked it a lot anyway. Why doubt ourselves? He was negotiating a contract to do an armature up in the Ohio demo, so, by all means, we financed some of it.
We were right, of course. We own about 30% of the company, and it has been one of the three major armature installers for twenty years, now. And armatures have turned out to be a very good thing. I mean, the night life!
I'm aware that most of my readers live in earlier centuries, so I ought to describe space, as we call it. The first structural matrix experiments were conducted around 2020, and by 2030 there were demos kind of everywhere. Poland was an early adopter, and their Great Matrix dominated views all over the region, a slender and tall matrix straddled Japan, and the Adirondack Matrix was slated to be the largest by far. Of course, the original experiments were in the American West, and the California Matrix was extensive, by then, and very nice, but then what happened? The Crash of 2030. So it was back to making do. But, as you would expect, a lot of prosperity has followed, since.
As everyone knows, even in 2030, the structural matrix experiments were mainly just super giant sculptures. Yes, people moved into them right away, but it was definitely a specialty. Still, they were amazing, and you could climb up into them (and tours was an early industry) and then you really were in space, so that was interesting. Awe, jeeze, I keep forgetting, you guys don't even know what structural matrix is. I mean, it rises like clouds of bubbles out of manufactories, and it's made a lot of the times out of metal, and it's, like, this matrix. And it spreads out over the countryside, like, over ridges, and down valleys, and it's just like this shimmering thing above you, if you visit those places, and then it gets connected, the whole matrix, and it can be extended to elevation, with some spots reaching 20,000 feet, which is to say, space. That's why we call it that. It's not Space, that's a whole other division of the economy, so we call it space. It's mostly what we talk about anyway, even though it seems we are headed into Space proper, and properly. (It's said that's sort of what structural matrix is about, but I'm not actually sure. space is its own thing.)
Anyway, the first structural matrix supported itself economically as a railroad, and all of them got started as basically utilities, financially speaking, outside of the tourist industry, but that was just starting. But the plan was always to live up there, and for that you needed armatures. When we got into it, development was just getting started ...
Who am I kidding? We were the initiators of structural matrix, you know that. By 2030 we had a trillion dollars in assets, but it's not that simple. We couldn't just sell it. Happily, we had invested in all sorts of stuff back in the oughts and teens, and sold a lot of it at the top, and then we were able to invest in armatures in the forties and fifties.
The actual origins of all of this is something we kind of don't speak of. It's sort of a secret. I mentioned we got our start in the American West. Anyway, at the beginning, in a certain sense - it wasn't the actual beginning, but it sort of was - we build a little railway line from a depot that we called up the hill to some fields in the valley, or, properly, it was canyon. We hired Swiss engineers, and they built it on slender cement piers, really pretty like, and to this day it trundles up and down the hill, carrying farm goods and equipment and supplies, and passengers. I remember to power it we installed twelve thousand ten centimeter square solar panels along a five mile linear array, into the desert on either side of the canyon. We were trying to push the limits at all cost.
We built a lot of stuff. We had to get people from this mesa top to the valleys below it. We built a stairway tower down some cliffs, that connected to some earlier stuff via tunnels carved in solid basalt, like in ancient times, and we built a very delicate bridge across the river and into the mesquites over there and from there you could make your way to an elevated walking path that extended into some higher desert, to a research station. The solar line intersected that making a nice x. We're still extending that system into the surrounding country.
At the particular time, we were just eking out an opportunity. You could have almost said it was, oh, an absurdity. We had to concentrate on building pleasant camp sites just so people could stay ... Ha ha ha ha ha.
October 1 2015 at 12:31 in the morning.
The thing that was essential, which the founder actually showed us, though it was in a way hard to understand, was proposing landscape spanning metastructure. It was meta because it wasn't actually doing anything, it was just there, and it was important that we built, right from the get go, a very great lot of it. due to simplicity, it was very cheap, so the question wasn't really whether to build it or not. the thing is, it has no shape, other than its own. it's not shaped around anything, or, well, it is, but only as itself. I mean, it is shaped around function. What it is is painting that in really broad strokes. By erecting sculptural metastructure we created huge expanses of completely pure potential.
We did dedicate a lot of resources to managing the structure, specifically by training metanauts. At first they were construction people, plain and simple, and they practiced the art of the bivouac. They weren't that rare of a breed, in fact. The work was fairly congenial, and not exceedingly complicated, and it was an adventure. Also, there were, even quite early on, certain facilities. If you were climbing, you could reach the First Cat catwalk, and it didn't take long for that to actually realize its potential. And you could reach the floating arena, by it, and there were a lot of presentations there.
Because of the nature of structural matrix, a lot of the design, and of assembly work, was impromptu. We would just drop off piles of matrix, and the folks would assemble them sort of as they saw fit. We made a decision not to control that closely, but we did carefully monitor it.
The other characteristic of structural matrix is that it accommodates change. In order to ensure that this was explored we developed exercises around armature installation. We would organize a void in the base of structure, build some large element in it, and then float it up through to the top. We built large components high up, then floated them downward, too, and then we moved them literally for miles horizontally, just to practice. We started turning these into transiting museums. They would collect stuff as they moved around structure.
That was an early opportunity to expand habitation experiments. We installed some of the first shells in the musea, and several groups of curators navigated space, many of them for years on end. Musea are still an important part of space today, and they still navigate it. They're like its mitochondria.
The very first metastructure bubbled up from our factory in a nebulous cloud. we changed it often for people's entertainment, and put a few small shells in it. The first actual metastructure habitat was the Great Pyramids of Tempe, of course, but for those who aren't completely familiar with it, the AZCentral Line originated there, at the time, and went as far as Seven Springs, where we built the Forty Story Towers, which made such a splash. Those were the world's first tower clusters, and that form has become so important. They're light on the earth, so they were pretty widely approved of, and they were conceived of for livability. The community up there has always been solid. But there was a ten year period when we couldn't extend the line north. We did build the branch line to Cave Creek, which is a really small train, and a slow one, but it allowed one to travel from Tempe to Cave Creek by train, and it was popular.
We did, of course, a great deal of design work. The early automation was vital to it, and that had to be created, to start with. Then we just launched a series of extremely granular proposals. Once those were in place construction was straight forward, and continued apace. We didn't use a lot of matrix proper, on those early projects, but we started building a lot of cubic matrix on matrix platforms, keeping a lot of it very light, and spreading it out wide. That's how a lot of the line ended up being built, and we introduced the first shells in there - well, tower clusters are shells - but we suspended a hundred lily pad platforms for camping three hundred feet above New River ... and kept them lightly occupied for years and years. Lily pads, by the way, swing in the wind. But some people settled them. It was, again, good, with the train connection.
cat paws
y mw fv ABMC AMER BIO MEDICA CORP COM 1000 cb$126.95 9-28-2015 Yes it could go sideways for more years. It's quite a shapely chart, though. Yes it could dip below 10 cents, but that would be a fairly strong positive, really. And the target is clearly marked in a ten year chart, at .9. It's a hold.
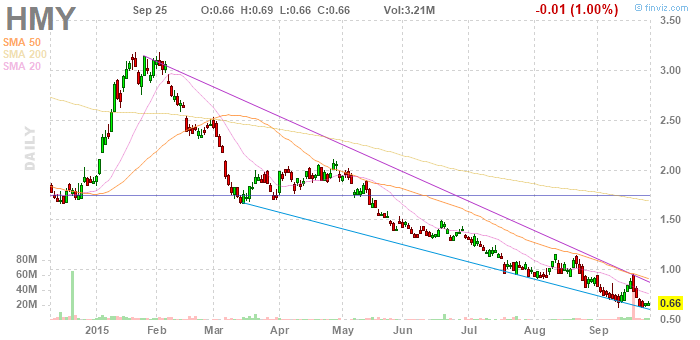
y mw fv 9-28-2015AU ANGLOGOLD ASHANTI LTD LVL1 ADR EACH REP 1COM ZAR0.25(BNY) 7 cv$56.42@7.40 cb$109.73
9-28-2015 at 7.40. Down trend is still in force. There's no buy signal here. The next target - after lower prices - will be 13. That could be pretty soon. Then lower prices again. Look for a dip to under 5 short term, though, so there's an argument for selling here. You're losing 50%, but avoiding the annoyance of watching it go to $3 here and stay there for some months.
Sunday, September 27, 2015
methodological update
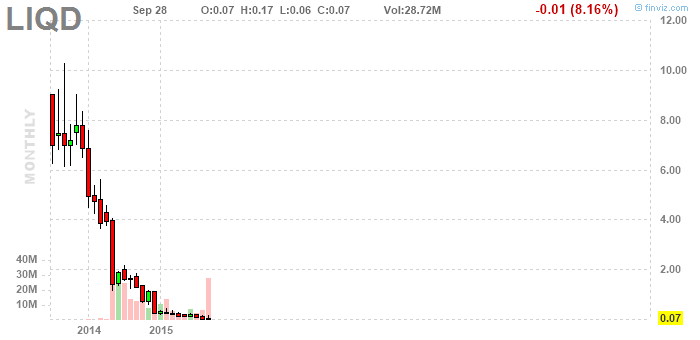
i've been looking at monthly charts a lot the last few days. i was trying to figure out whether a longer term approach might be the answer. after a while, though, i actually concluded that my best bet is daily charts, period. absolutely, you can find trades in monthly charts, and they will have very good projected returns, like 500%, or +5000%, but you will need to wait for months to realize those returns. thinking it over, i quickly realized that i want to realize my gains within weeks, not months. waves of one or two month's duration are detailed on daily charts, not on monthly charts. the monthly charts are quite useless for analyzing waves of such short duration. i've stopped even looking at them, and i've stopped including them in my writeups.
depending on the circumstances, it could make absolute sense for some readers to study monthly charts. if your time horizon is extended, you can pick stocks with buy signals in them at the end of the month, and analyze a trade on a ten year monthly chart exactly as you would a short term trade on a one year daily chart. this could work very well for someone investing a little bit of money every month, and it could work well for someone with a ton of cash. me, i'm quite pointedly looking for action, so the daily charts are where it's at.
by the way, i am not day trading, period. this is all end of day trading, with orders in the market overnight, and even good until cancelled.
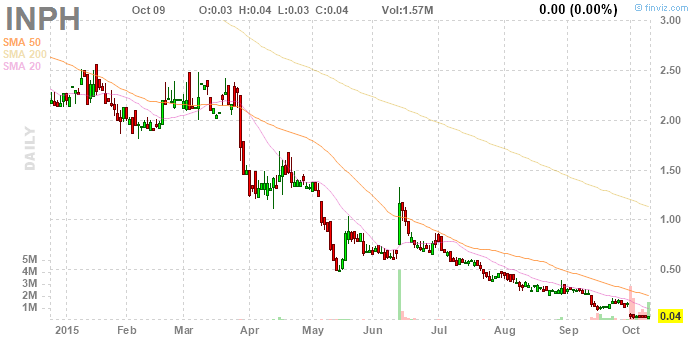
inph
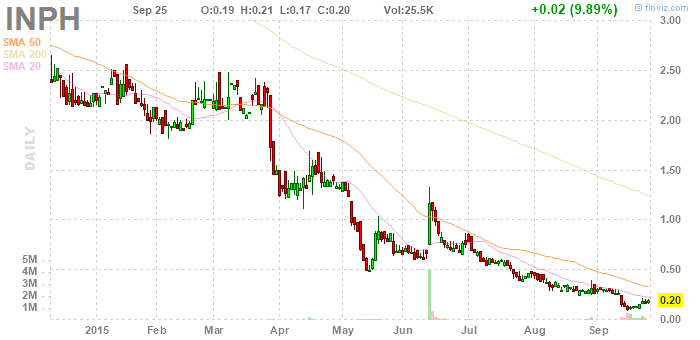
profile ymax fv september30 there was ... oh ... a bottom, a buy signal, at something like .15, a few days before this. that's the buy price. it's kind of just the hint of a bottom ... who knows? ... but it is priced, and the marked price for selling is there at 1.5, no, 1.3, if you're very on the ball, aor at .75 if you want to make it automatic ... (99)@
i looked at about twenty stocks, and about 15 of them were giving buy signals. is this some kind of market bottom? anyway, i selected the top five based on projected gain as per the prepattern sell signal theory, and logged them. the bottom ten of those 15 with buy signals had only projected gains in the under 50% or under 100% area, but then i started to find some with 2x and 3x projected gains, using the same rules, and being conservative with them ... though, granted, it's hard to apply them very strictly. anyway, Kiyosaki was talking about looking at 100 properties before choosing one. the first one looks great, but then so do the first 20, and then number 21 is like several times better, i think i the effect we're looking for. and we're not anywhere near 100!
this morning i ran a test on historical data. i looked at several charts, just like normal, but i looked for buying patterns in August and, as it turned out, July. first i was turning up duds, but i studied them more closely, and the prepattern sell signals had not predicted much. one with better prepattern prospects did fine - and the others did fine according to the rules, there just wasn't much upside in them to start with. with this in mind i started looking at current patterns again and came up with this trade.
buying another $100 lot (on paper)
Saturday, September 26, 2015
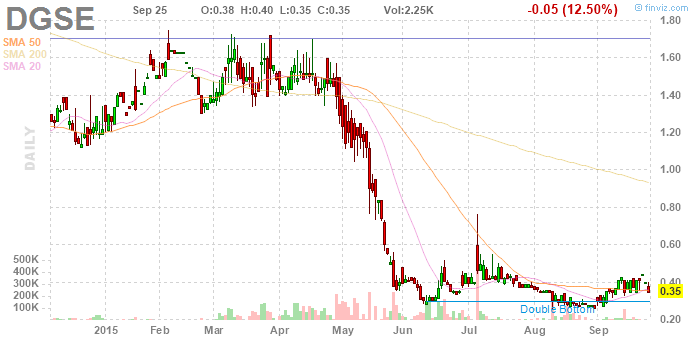
dcth
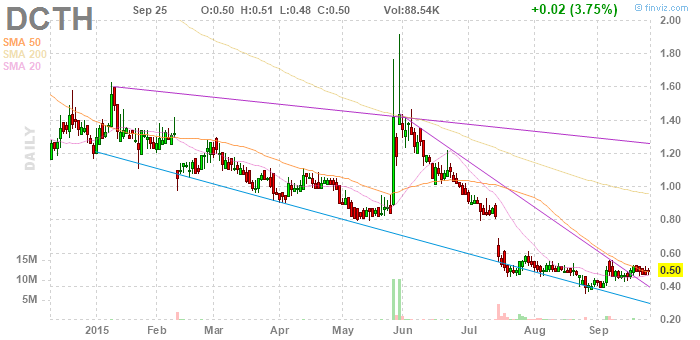
profile ymax fv September26 (a Saturday).8 is pretty much a given. i mean, i'm bending the rules a little, but i think in this particular case it's justified. plus, there are higher prices marked: $1.20, $1.40. trade management is probably the answer. primary sell signals are ones you can see when/before you enter the trade. secondary sell signals are ones that appear after trade entry, which is to say after the trade is signaled. the first primary signal is, let's say, .75. once that price is reached, if there's a sell signal, it's a sell at that price. and if there weren't any higher primary signals, it would be a sell there anyway, but since there are primary signals above .75, we can wait for a secondary signal, which is quite likely to be given around those higher primary signal levels, and above .75. if we can sell above a dollar this becomes an actual double.
Friday, September 25, 2015
cpah
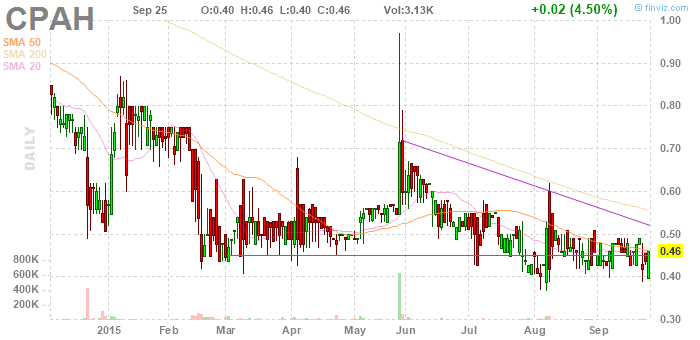
profile ymax fv September25buying (on signals) in 2014, at .55, with a sell signal at .78, for something like a 40% gain, then in Feb at .44 with a sell signal at .62 for a 30% gain, then in April at .5 with a sell signal at .68 for a 30% gain, then at .6 in June for, by now, a break-even if you sold it in August, and in July at .44, remember that price? with a sell signal at .58, the July top, for a 30% gain, and now signals in the .44 area, again, and we might get one in the .40 area, with a sell signal at .62 for a 50% gain ... so, this stock is not that great for short term trading! but it does produce +30% trades regularly.
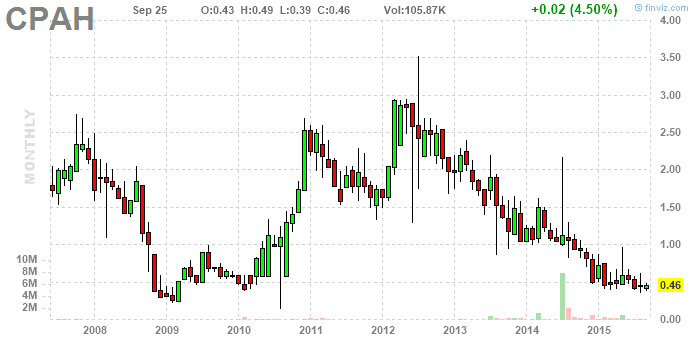
it is, however, well positioned to go to $3.50 and to still be there a year from now.
i'm back with more to say. my whole premise, posting all these charts today, is to get perspective, and am i ever! for example these monthly charts are really starting to speak to me. buy signals at 18 in 2008, at .4 in 2009 with a full sell signal at a predictable level at .75 for a near double, at .6, .7, .6 and then in 2010 at .5, a nice one, and all of those quickly doubled, and then what do you know, it spiked right down to the lows again. gotta remember that. then on to the next level, which was 2, marked in 2008, then buy signals at 2.2, quickly becoming a sell signal at 2.1, then buy signals at 1.8 and 1.7, with sell signals in place at 2.25 or 2.7, take your pick, a buy signal at 2.8 becoming, not surprisingly, a sell signal at 2.8, when the price spikes lower, which we would have seen it doing on daily charts, thus, a buy signal at 1.4, really, with the sell signal in place (the dragonfly) at 2.8, then another dragonfly, and another spike lower, and no recovery, but there's the third dragonfly ... interpret that ... it's a buy signal, and then it spikes to ... oh, forget it ... the third dragonfly becomes a stop, and the buy at 2.50 becomes a 20% loss. a buy signal at 1.50 in Fall 2013, a buy signal at 1.25 next, with a sell signal at 1.60, a buy signal at 1.10 with the same sell signal still active, and it makes a top there, too, buy signals, buy signals, buy signals, lower prices, and now, buy signals, at .5, with a sell signal in place at a dollar.
is this a longer term buy now. in the abstract, absolutely ... long term buy. but i'm expecting a top at $1, so why not wait? and then, after that, i'm expecting a top at $2, so why not wait for that, too?
hmmm. trading in and out every three or four months is what this amounts to. frankly, i'd prefer not to have to wait that long. maybe i'd like to trade in and out every three or four weeks! does that mean i should focus on weekly charts?!!? regardless, what i've just described is a version of inching forward, with gains of (some modest number of) percent per trade. but, if it's reliable, inching forward couldn't exactly be called a bad thing. am i scrambling? maybe i'm scrambling. but if i'm making progress and i like it, maybe i should scramble. those daily bar charts make buying patterns ...
cntf
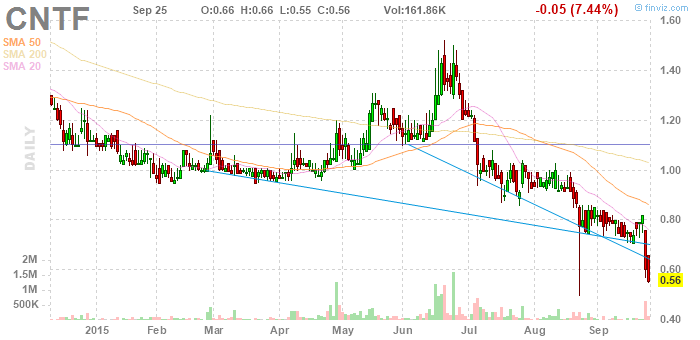
profile ymax fv September25buy signals all through the Spring with not much to show for them and now it's buy signals, into the fall, i suspect, and i like them ... buying around .5 for a quick double ...
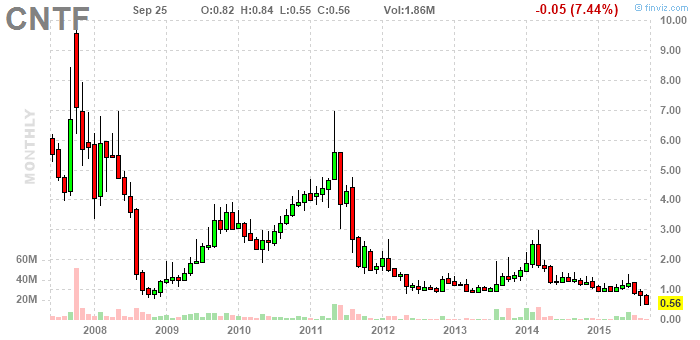
buy signals early, at 1, topping out at 4, easy, buy signal at 4, then at 2, then at 1 again, and again, topping out, not irrationally, at 2.75, then at 1 again, and now at ., well, 9, .9, but we might see more at .5 ... that's it, it's a buy, short and intermediate term ... about the long term, maybe not ... but, maybe.
cnet
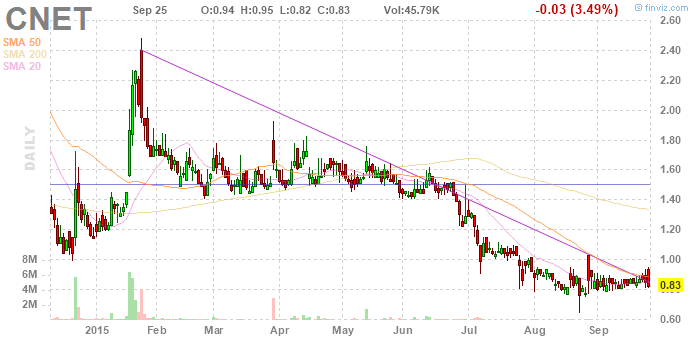
profile ymax fv September25 buy signals in December and January each produce a nifty double or almost (see comments on exiting, elsewhere on the blog). then there was a wave of buy signals that produced, thus far, the opposite of a double, and now, lots of buy signals that i think will produce another nifty double.
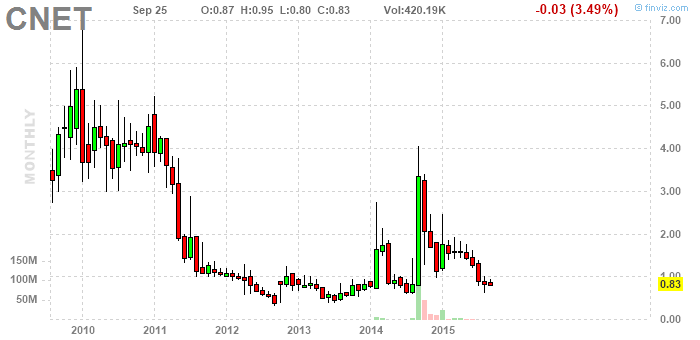
buy signals in 2012 - throughout - and 2013, for a nifty double (price marked at just below 3 in 2011, so, a tripple, really ... but see here, this is now an intermediate term signal we're trading the way we usually trade a short term signal, almost ... it seems we need limber minds to really play this game ... but that's why we're studying all these examples ... and then in 2014 for another nifty gain ... it's intermediate term trading, based on monthly patterns, but we're out in a month ... and buy signals right here and now, again. the short term target is a double, the intermediate term target is $4, and, is this a buy and hold play? of course it is. i mean, there's a volatility question, but my bet is it's a good company. we are building, by the way (in this hypothetical environment) a portfolio of Chinese stocks. what, you're not impressed?
actually, i'm going to say no to buy and hold on this one. the strange thing that's happening is a built in bias in our strategy towards the short term trade, not because we think it's superior but because we see so many short term signals, and our strategy is essentially to put $100 into every signal. or, in this chart, there are all these intermediate term signals ... and then i think here they kind of rule the roost, for now. if we buy and hold we'll have to hold through plenty of low price episodes, i think.
clrx
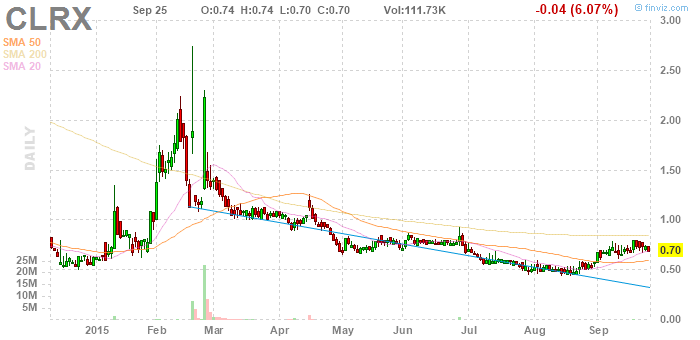
profile ymax fv September25it goes on and on and on. wait, do i own this? anyway ... buy signals in December, and in January, and both produced a nifty double. then there was the dragonfly in mid Feb, and a dew drop the next day, both buy signals, if at elevated prices. Also, the dragonfly became a sell signal as soon as the dew drop formed. if you thought about it that way you could have traded it. then, signals all through every month since, even right now, this instant, fine for an instant double.
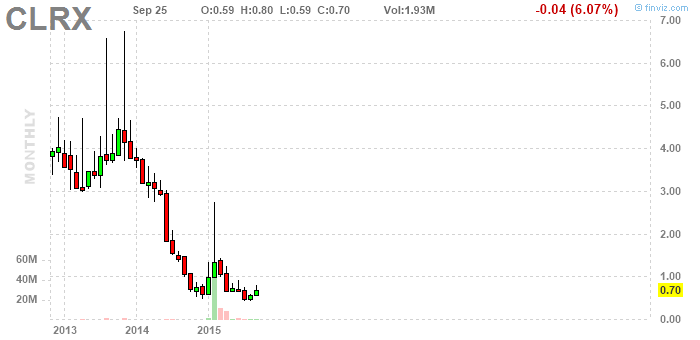
i guess this wouldn't be my first pick for buy and hold, or intermediate term trade, either, not that there's anything at all wrong with it. what do you think about the company? (see the profile link)
Subscribe to:
Posts (Atom)