profile ymax fv plan is to buy at the late October dip low .642 and
Saturday, October 31, 2015
thti
profile ymax fv plan is to buy at the late October dip low .642 and
Friday, October 30, 2015
Friday, October 16, 2015
abtl
profile ymax fv
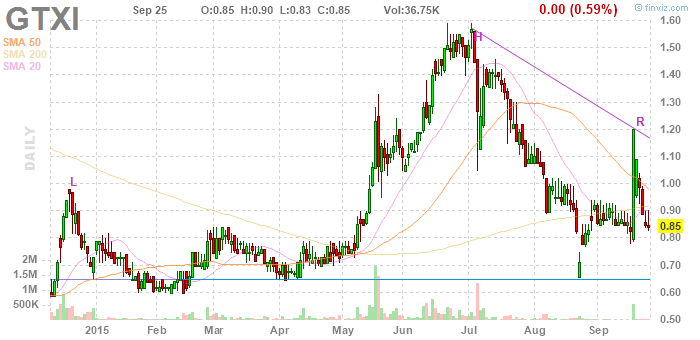
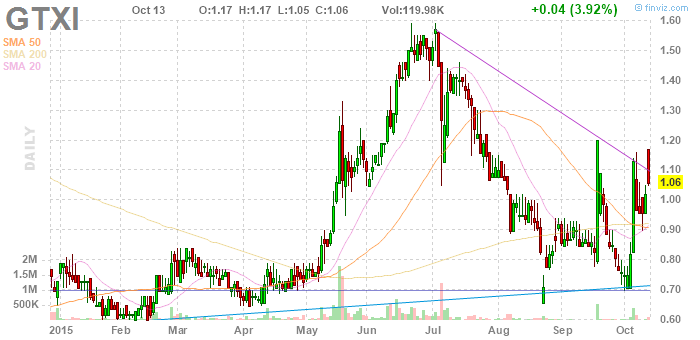
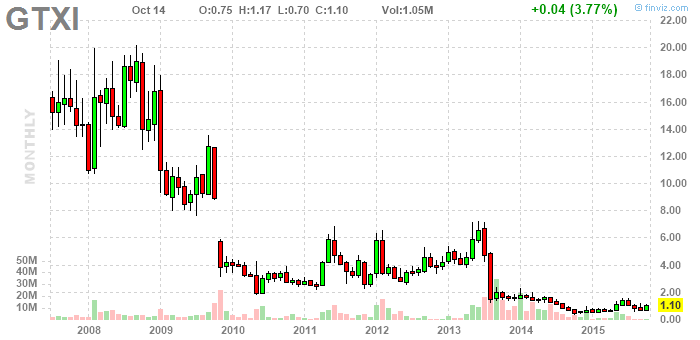
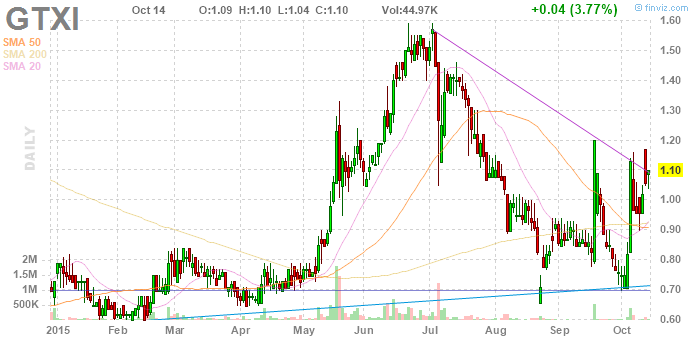
where is it headed? isn't it working on a breakout? but will the breakout be definitively signaled? hasn't it just been definitively signaled (instant rally from 15 to 20 October 2015). now we need a stop. actually, there is $15 ... but a closer one would be nice. and now? to 75 viz a twenty year chart (ymax) ... right?

actually, it's breaking out right now ... and it's only noon. basically the stop is now $20. (becomes in the market stop at the day's low if prices go below $20 one day.)
Wednesday, October 14, 2015
Tuesday, October 13, 2015
Sunday, October 11, 2015
adat
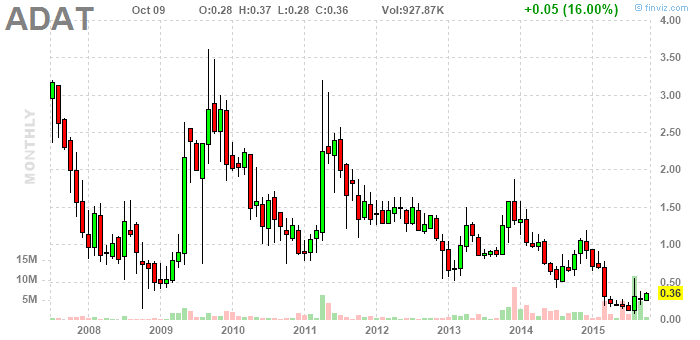
also ...
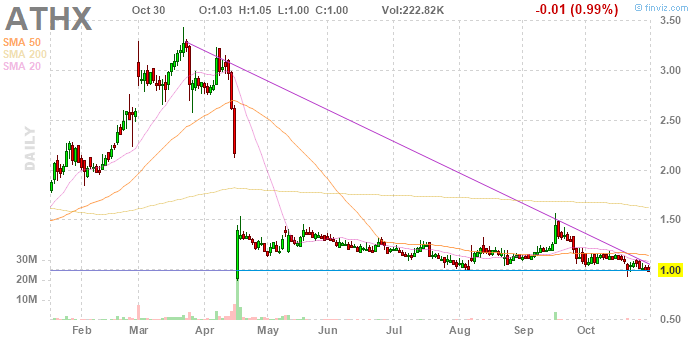
a prominent wave in early 2008, with a dragonfly doji in April
then this top was tested, but prices then went lower.
January 2009, invert hammer doji buy signal. the subsequent rally went right by the March 2008 top.
There followed in August 2009 a quick dip back to the base pattern - the magic trade, if you had an order in. The sell signal at that point was - this is according to the system, although it's one of the harder parts of it to interpret - 2.5.
The August dip is now a clear heel, echoed by a heel in October 2010, high dragonfly candle, and then a small dragonfly toe in January '011, buy signal, order filled, followed by a nice sharp rally mostly retracing the 2009 top. Again, not the easiest prediction, the 2011 top, but after the big green candle (April '11) a red dragonfly, whose real body indeed provided the limit price for selling ... for a double.
Sure, it was a heel later in 2011, doubling up, and a sturdy invert hammer in later 2012, if the earlier 2012 dragonfly didn't tempt us first, and then all that failed ...
Into a heel and dragonfly toe in early 2013, and then a two step rally. Now we have a second two step rally ... developing.
Although the second time is a charm, it also mirrors the first time, which supports my hypothesis of a sell at .7.
Analysis complete.
Earlier ADAT posts ...
abac
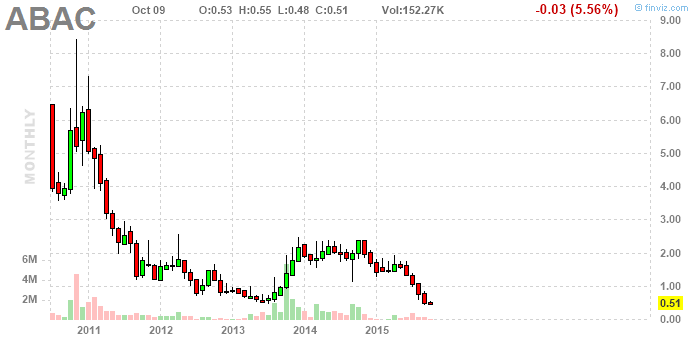
second chart reviewed with the new criteria in mind and second seeming critical stage buy.
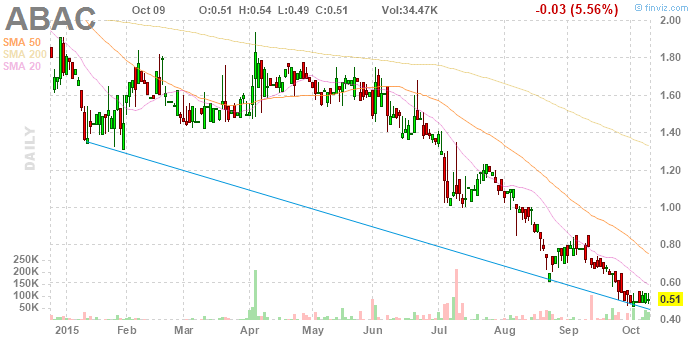

This was supposed to be an investigation of historical events but it seems to be turning into an inquiry into the present. But now we can look at at an historical bottom. Buy signals in early 2012, and in the middle of 2012, and then continuously from late 2012 into mid 2013. Oh, and note that the rally after mid 2013 wasn't that significant although it did triple and went straight to almost exactly the 2012 top. What would we have been waiting for, in 2012? Not months of buy signals, right? The breakout in August was system compliant lower low, higher high. It's highly likely there was a buy signal in the daily chart after that. Seriously? Are we waiting for that clear a breakout. Again I find myself thinking probably not, not yet, but we do have our small target trade on record, now.
profile ymax fv
aau
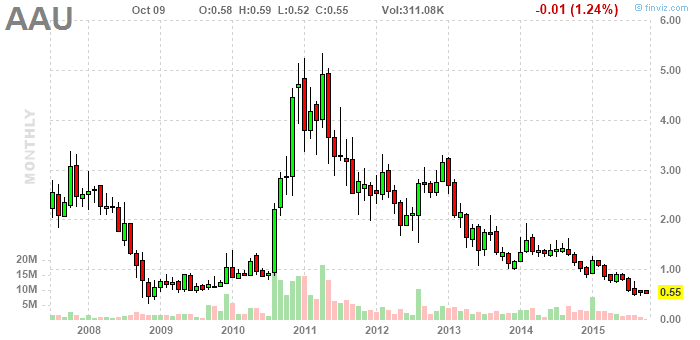
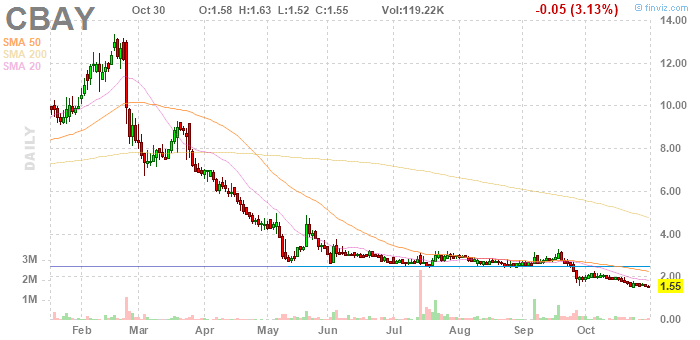
noteWe have, in 2008, an uninterrupted sequence of lower highs and lows - a cascade. It is followed by ... 18 months of gradual appreciation (2x), then five months of rapid appreciation (5x). CBs in 2009/second half and early 2010, twice. Other CBs are in 2014 and the last two bars of the chart. Oh, and first half 2015. What is coming next? Wedge suggests another rally to wedge high, but we don't know a lot about the pattern. Tops at $3 suggest another top there, but we don't know how significant it will be. Similarly tops at $2. The events of 2009 - mid2010 could be called "distinctive".
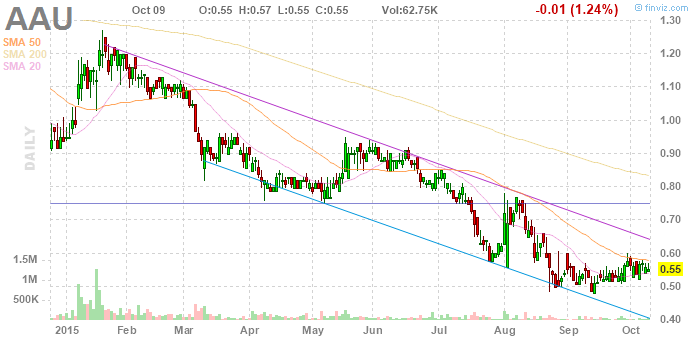
noteIf the events of 2009/2010 are distinctive, so are the events of August-October, here. There's evidence that the difference in scale is inconsequential ... the two similar forms will produce the same result, that is, another rally to 5.
noteThe system predicts, based on this pattern, a top, maybe at 2, with a retracement, maybe to 1 (should you sell at 2?), then a top at 3 with a retracement to maybe (extra maybe) 1? (should you sell at 3?) Then a top at 5, where you should sell. This should all happen quite fast ... although ... that top at 2 could be significant. But, due to the wedge quality of 2010 to 2015, the system does not predict a gradual advance like 2009-10. There is a now pointy wedge from 2013 to the present, a now pointy wedge from 2012 to the present, and a now pointy wedge from 2010 to the present. THIS IS WHAT THE SYSTEM PREDICTS. WHETHER THE SYSTEM IS RELIABLE OR NOT IS UNKNOWN. THE EVIDENCE IS SO FAR ON BALANCE NEGATIVE THOUGH WITH CERTAIN DISTINCTLY POSITIVE RESULTS. WE HAVE MADE CERTAIN ADJUSTMENTS RECENTLY WHICH, IN LIMITED TESTING, TEST OUT WELL, BUT THE RESULT IN THE PRESENT INSTANCE REMAINS EFFECTIVELY UNKNOW.
SOMETHING IS FISHY. The tops at 2 take on increasing significance as we re-run certain algorithms.
Will there be buy signals as prices drop from 2 towards 1? If we ignore initial signals, will prices drop to .5 again, or even below? Will there be buy signals in the daily chart (or even the monthly) after prices drop (from 2 back and) below .5? The system suggests these events are, in fact, probable.
Analysis complete.
profile ymax fv
Saturday, October 10, 2015
ahc
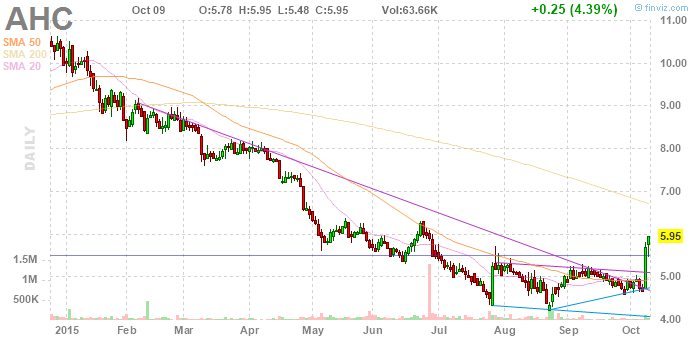
big city newspapers. The article is dismissive, simply put, but a flexible reading could suggest it's worth a look. After all, it's a serious article in a major publication that is completely focused on solid businesses, and the stock is mentioned by name, linked, and termed "an option". (That's not actually a quote, or, it only might be. I'm paraphrasing.) Even the premise sounds a little doubtful, namely that newspapers might be dead, or that big city newspapers might be. I read one time that newspapers actually make a lot of money, and my big city newspaper has all the feel of influence and prosperity, I'll tell you. Anyway, I take a look at the chart, and it's really quite good. It's got heels and a breakout, large scale. Now we wait for a dip.
profile ymax fv
note
note
Subscribe to:
Posts (Atom)