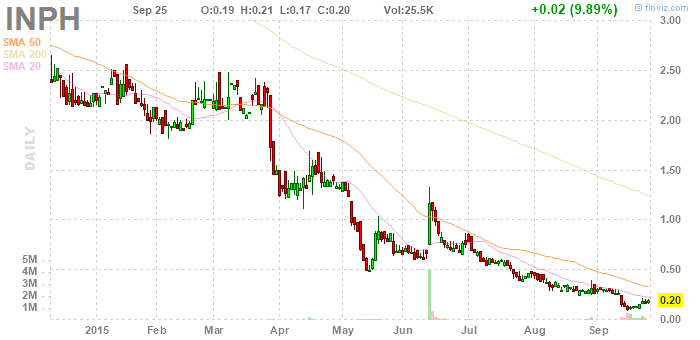
profile ymax fv september30 there was ... oh ... a bottom, a buy signal, at something like .15, a few days before this. that's the buy price. it's kind of just the hint of a bottom ... who knows? ... but it is priced, and the marked price for selling is there at 1.5, no, 1.3, if you're very on the ball, aor at .75 if you want to make it automatic ... (99)@
i looked at about twenty stocks, and about 15 of them were giving buy signals. is this some kind of market bottom? anyway, i selected the top five based on projected gain as per the prepattern sell signal theory, and logged them. the bottom ten of those 15 with buy signals had only projected gains in the under 50% or under 100% area, but then i started to find some with 2x and 3x projected gains, using the same rules, and being conservative with them ... though, granted, it's hard to apply them very strictly. anyway, Kiyosaki was talking about looking at 100 properties before choosing one. the first one looks great, but then so do the first 20, and then number 21 is like several times better, i think i the effect we're looking for. and we're not anywhere near 100!
this morning i ran a test on historical data. i looked at several charts, just like normal, but i looked for buying patterns in August and, as it turned out, July. first i was turning up duds, but i studied them more closely, and the prepattern sell signals had not predicted much. one with better prepattern prospects did fine - and the others did fine according to the rules, there just wasn't much upside in them to start with. with this in mind i started looking at current patterns again and came up with this trade.
buying another $100 lot (on paper)