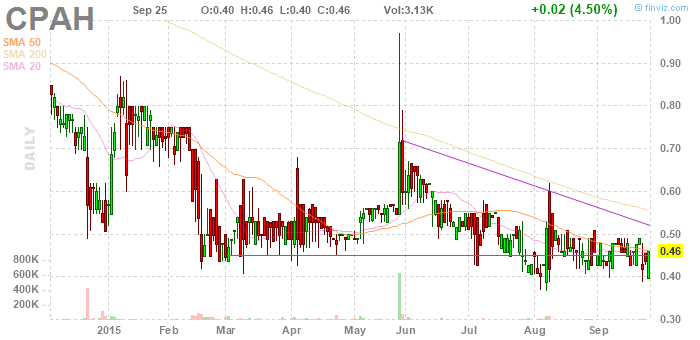
profile ymax fv September25buying (on signals) in 2014, at .55, with a sell signal at .78, for something like a 40% gain, then in Feb at .44 with a sell signal at .62 for a 30% gain, then in April at .5 with a sell signal at .68 for a 30% gain, then at .6 in June for, by now, a break-even if you sold it in August, and in July at .44, remember that price? with a sell signal at .58, the July top, for a 30% gain, and now signals in the .44 area, again, and we might get one in the .40 area, with a sell signal at .62 for a 50% gain ... so, this stock is not that great for short term trading! but it does produce +30% trades regularly.
it is, however, well positioned to go to $3.50 and to still be there a year from now.
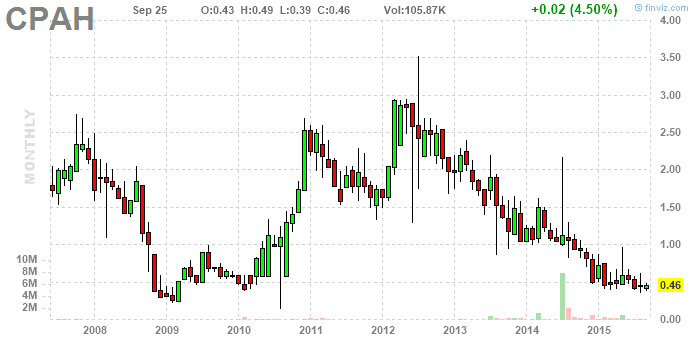
i'm back with more to say. my whole premise, posting all these charts today, is to get perspective, and am i ever! for example these monthly charts are really starting to speak to me. buy signals at 18 in 2008, at .4 in 2009 with a full sell signal at a predictable level at .75 for a near double, at .6, .7, .6 and then in 2010 at .5, a nice one, and all of those quickly doubled, and then what do you know, it spiked right down to the lows again. gotta remember that. then on to the next level, which was 2, marked in 2008, then buy signals at 2.2, quickly becoming a sell signal at 2.1, then buy signals at 1.8 and 1.7, with sell signals in place at 2.25 or 2.7, take your pick, a buy signal at 2.8 becoming, not surprisingly, a sell signal at 2.8, when the price spikes lower, which we would have seen it doing on daily charts, thus, a buy signal at 1.4, really, with the sell signal in place (the dragonfly) at 2.8, then another dragonfly, and another spike lower, and no recovery, but there's the third dragonfly ... interpret that ... it's a buy signal, and then it spikes to ... oh, forget it ... the third dragonfly becomes a stop, and the buy at 2.50 becomes a 20% loss. a buy signal at 1.50 in Fall 2013, a buy signal at 1.25 next, with a sell signal at 1.60, a buy signal at 1.10 with the same sell signal still active, and it makes a top there, too, buy signals, buy signals, buy signals, lower prices, and now, buy signals, at .5, with a sell signal in place at a dollar.
is this a longer term buy now. in the abstract, absolutely ... long term buy. but i'm expecting a top at $1, so why not wait? and then, after that, i'm expecting a top at $2, so why not wait for that, too?
hmmm. trading in and out every three or four months is what this amounts to. frankly, i'd prefer not to have to wait that long. maybe i'd like to trade in and out every three or four weeks! does that mean i should focus on weekly charts?!!? regardless, what i've just described is a version of inching forward, with gains of (some modest number of) percent per trade. but, if it's reliable, inching forward couldn't exactly be called a bad thing. am i scrambling? maybe i'm scrambling. but if i'm making progress and i like it, maybe i should scramble. those daily bar charts make buying patterns ...