second chart reviewed with the new criteria in mind and second seeming critical stage buy.
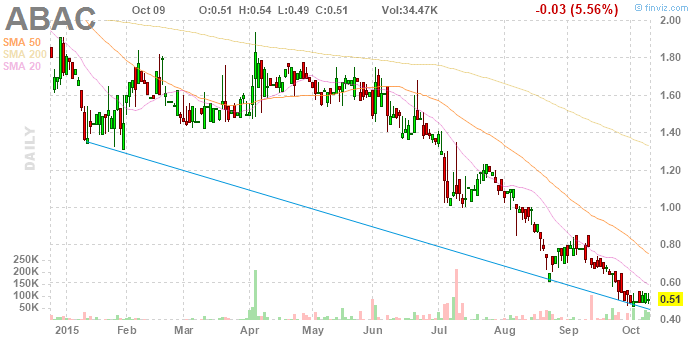

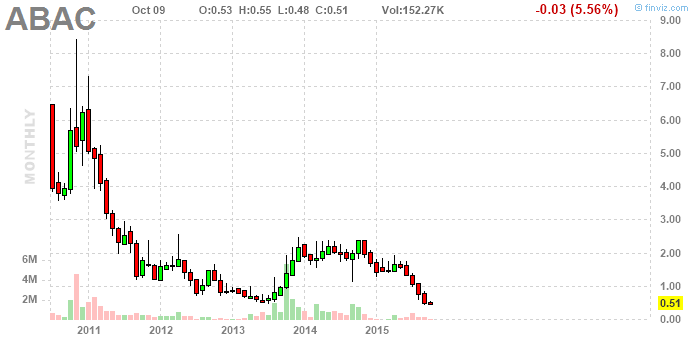
This was supposed to be an investigation of historical events but it seems to be turning into an inquiry into the present. But now we can look at at an historical bottom. Buy signals in early 2012, and in the middle of 2012, and then continuously from late 2012 into mid 2013. Oh, and note that the rally after mid 2013 wasn't that significant although it did triple and went straight to almost exactly the 2012 top. What would we have been waiting for, in 2012? Not months of buy signals, right? The breakout in August was system compliant lower low, higher high. It's highly likely there was a buy signal in the daily chart after that. Seriously? Are we waiting for that clear a breakout. Again I find myself thinking probably not, not yet, but we do have our small target trade on record, now.
profile ymax fv