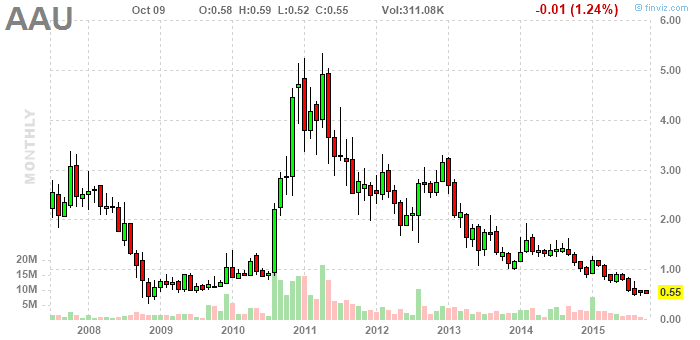
noteWe have, in 2008, an uninterrupted sequence of lower highs and lows - a cascade. It is followed by ... 18 months of gradual appreciation (2x), then five months of rapid appreciation (5x). CBs in 2009/second half and early 2010, twice. Other CBs are in 2014 and the last two bars of the chart. Oh, and first half 2015. What is coming next? Wedge suggests another rally to wedge high, but we don't know a lot about the pattern. Tops at $3 suggest another top there, but we don't know how significant it will be. Similarly tops at $2. The events of 2009 - mid2010 could be called "distinctive".
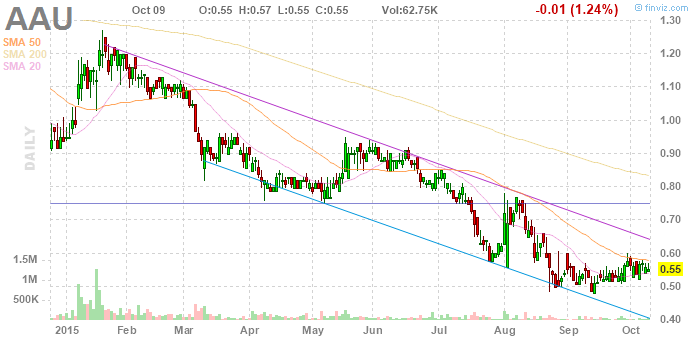
noteIf the events of 2009/2010 are distinctive, so are the events of August-October, here. There's evidence that the difference in scale is inconsequential ... the two similar forms will produce the same result, that is, another rally to 5.
noteThe system predicts, based on this pattern, a top, maybe at 2, with a retracement, maybe to 1 (should you sell at 2?), then a top at 3 with a retracement to maybe (extra maybe) 1? (should you sell at 3?) Then a top at 5, where you should sell. This should all happen quite fast ... although ... that top at 2 could be significant. But, due to the wedge quality of 2010 to 2015, the system does not predict a gradual advance like 2009-10. There is a now pointy wedge from 2013 to the present, a now pointy wedge from 2012 to the present, and a now pointy wedge from 2010 to the present. THIS IS WHAT THE SYSTEM PREDICTS. WHETHER THE SYSTEM IS RELIABLE OR NOT IS UNKNOWN. THE EVIDENCE IS SO FAR ON BALANCE NEGATIVE THOUGH WITH CERTAIN DISTINCTLY POSITIVE RESULTS. WE HAVE MADE CERTAIN ADJUSTMENTS RECENTLY WHICH, IN LIMITED TESTING, TEST OUT WELL, BUT THE RESULT IN THE PRESENT INSTANCE REMAINS EFFECTIVELY UNKNOW.
SOMETHING IS FISHY. The tops at 2 take on increasing significance as we re-run certain algorithms.
Will there be buy signals as prices drop from 2 towards 1? If we ignore initial signals, will prices drop to .5 again, or even below? Will there be buy signals in the daily chart (or even the monthly) after prices drop (from 2 back and) below .5? The system suggests these events are, in fact, probable.
Analysis complete.
profile ymax fv