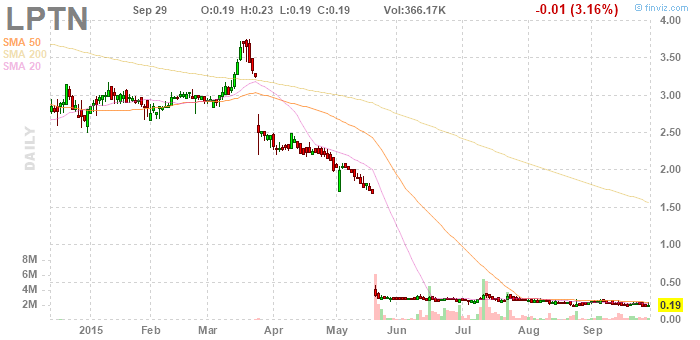
y mw fv note i simply cannot predict whether this will move immediately or only after more months have elapsed. there's nothing definitively telling me it's ready to move right now, even though it is making buy signals, and it is extended sideways quite significantly. i would say there is a very high probability it will go up, quite a lot, and fast, once it gets going. tops are predicted at a dollar, two dollars, three dollars, and four dollars. what do these offer? a slight reduction in risk?
suddenly i feel this is not the kind of chart to look at for short term appreciation. it's more of a long term chart. i'm gonna look for a different kind of pattern for short term trading.
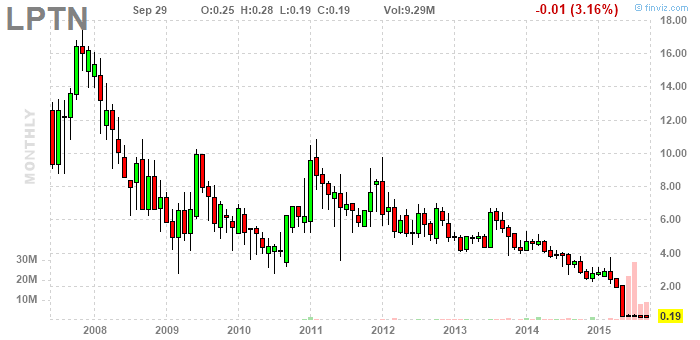
note upon consideration i say expect a series of tops at $4 over a period of years (with prices returning to under 50 cents between them). after that it can move up to making tops at $10.
what is my theory about these tops. i don't think it's a complete given that selling just because a top is forming (then buying back when there are sell signals again) will increase profitability, but maybe if we can sell very near tops reliably, it can. how likely is it we will be able to do that? well, in the case of some tops, we won't be able to do it ... unless we watch the market intraday. in other cases, though, when a rally is developing towards a predicted top at a more leisurely pace, say, over a period of days, even weeks, we might indeed be able to sell near the tops.
note
note